Unveiling VDI Advanced Diagnostics and Support Features in CommandCTRL
postdate: 15-01-2024
As Horizon desktops become more prevalent, it's essential to analyze the metrics of both the Horizon desktop and the endpoint utilized for access. This functionality empowers support to observe the metrics for the local endpoint and overlay the display metrics from the Horizon VDI desktop on the same screen. This benefits troubleshooting processes by offering comprehensive visibility from end to end.
CommandCTRL from Liquidware can help with this. I've talked about it in a previous blog, which you can find here, “How to start with Liquidware CommandCTRL”.
Now I will mainly be writing about how to keep an eye on both the local client and the Horizon VDI from both sides and checking out what's happening with the protocol and client during the session.
So, for this blog example, I set up:
My trusty Windows 10 on the client side
Diving into the Horizon with Windows 10 VDI
Just to spice things up, threw in a Full HD YouTube video for good measure.
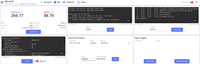
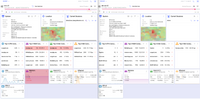
Client-side session details:
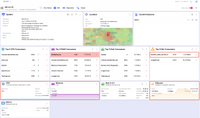
You can spot some action on the client's network thanks to the Horizon client, Memory, and Disk not showing any load.
Horizon VDI Side started a session with the YouTube video.

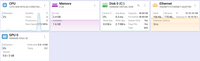
The VDI session details:
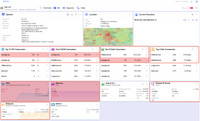
What distinguishes itself within the Horizon VDI realm? It becomes evident that the Horizon VDI session significantly exerts more of its resources, aspects not readily apparent on the client side, due to the presence of a concurrently running YouTube video.
A deeper dive into the Display Protocol unveils a rich repository of session statistics, providing valuable insights into the dynamics of the entire operation.
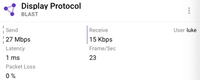
When delving into the current session details, it unveils the current user along with the employed protocol in this instance, it's Blast.
Returning to the client, there are several measures available to address user concerns. Frequently, the IT support desk receives queries regarding sluggish sessions or issues with text synchronization. To troubleshoot such problems, navigating to the "Diagnostics" section proves to be a valuable resource.

Within the Diagnostics section, a variety of tasks can be undertaken to pinpoint and address user issues. The features are:
- Speed Test
- Ping
- Traceroute
- Get IP
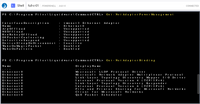
- GPO report
- Agent Logging
The Shell function can help run troubleshoot scripts or commands.
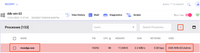
Zooming in on the CPU and Memory within the Diagnostics section allows for a granular examination of processes consuming the most resources. If needed, you can terminate a specific process.
A comprehensive view of global information is readily accessible, providing a holistic understanding of the system's current status and performance.
DVR mode, also known as Playback Mode, proves to be another valuable tool. It allows for the simultaneous playback of recorded sessions for both the client and Horizon VDI, enabling a retrospective analysis of events and interactions during a specific timeframe.
This significantly enhances the efficiency of the troubleshooting session.
Command CTRL provides a comprehensive overview, enabling support desks to find an issue resolution. The integration with Horizon VDI amplifies the depth of information available, encompassing session details, utilized protocols, and real-time statistics for a more thorough analysis.
for more in-depth information and the latest updates, I recommend visiting the official Liquidware website.
If you have any questions about setting up or using CommandCTRL, please feel free to reach out to me directly. Thank you for taking the time to read through this guide. Your feedback is valuable, and if you have any remarks or suggestions, please don't hesitate to let me know. Happy exploring CommandCTRL!